Canvas Chart: Add a Visual Chart to Enhance Your To-Do List Sidebar
Canvas Chart is a free Chrome extension developed by Canvas Chart Extension. This add-on falls under the Browsers category and specifically the Add-ons & Tools subcategory. With Canvas Chart, you can add a visual chart to your canvas to visually track and enhance your to-do list sidebar.
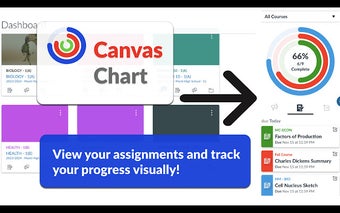
Canvas Chart aims to provide a better way to track and visualize your school work or any other tasks you need to complete. By adding a chart with rings for each class, the extension allows you to visually see your progress as you complete items on your to-do list. The rings close as you complete more tasks, giving you a clear indication of your progress.
In addition to the chart, Canvas Chart also creates a to-do and completed list below the chart. You can change the color of the course tiles to customize the color of the rings, making it more visually appealing. The extension allows you to update your to-do list and see the chart progress by completing or checking off items.
Canvas Chart offers some additional features to enhance your experience. You can change the timeframe via the settings button and choose between daily, weekly, or monthly time frames. If you accidentally mark a task as complete, you can easily unselect or undo it to move it back to the to-do list. As you check off items, you'll even be rewarded with fun confetti on the screen. The extension also allows you to add custom tasks via the "+" button at the bottom of the list.
To start using Canvas Chart, simply click the "Add to Chrome" blue button above. After installation, don't forget to reload your canvas to see the chart in action. Give Canvas Chart a try and improve your task management experience today.